Creating the postcard map
For a number of years now, we've been receiving a ton of postcards from listeners of our podcast Geschichten aus der Geschichte.
I'm immensely grateful for this, so we usually talked about them in our feedback episode. But this year was a bit wild, so there were far fewer feedback episodes. Which meant that while we've kept receiving postcards, we had nowhere to go with them.
Which reinforced this idea I'd been hatching for a few years to give them a home not just in our episodes, but on the web as well.
I know my way around coding a lil bit, but not nearly as much as I'd need to get something like this work properly on my own: cue Gemini 3! It had just come out and people were hailing it as a great coding companion, so I decided to find out whether it's true.
And what can I say, it is!
The basic architecture
To build this, I chose a standard LAMP stack (Linux, Apache, MySQL, PHP) hosted on Cloudron. Why? Because setting up a box like that is as easy as it gets.
- Backend: PHP 8 handles the logic. It is robust, easy to deploy, and handles the atomic file operations natively.
- Database: MySQL stores the structured metadata (Sender, Date, Location).
- Frontend: There is no React, no Vue, and no complex build step. I used Vanilla JavaScript and CSS. This ensures the site is extremely lightweight and future-proof.
- Map Engine: Leaflet.js handles the tile rendering and interaction.
This simplicity means I can edit a file and see the result instantly, without waiting for a CI/CD pipeline to compile a massive JavaScript bundle.
How to keep it speedy
Knowing that a lot of postcards could slow this thing down, I focused on speed from the start. Well, not from the start exactly, but after adding a bunch of cards, I decided to move from jpegs to webps. Which did considerably cut down on loading time. But I wanted more, especially when there'd be a lot of visitors simultaneously.
So to solve the database load, the map is now bypassing the database entirely for read operations. Instead of hitting MySQL on every page load, Gemini created a "Builder" script. This script runs whenever a new postcard is added to the map. It fetches the relevant columns (ID, Lat, Lng, Thumbnail, Sender) and dumps them into a static JSON file.
When a visitor opens the page, their browser simply downloads this one static text file to render the map markers. The web server serves it instantly, treating it just like an image or a CSS file. The heavy database is only queried if the user scrolls down to the "List View" or uses the search function—meaning the map itself is effectively immune to database load or crashes.
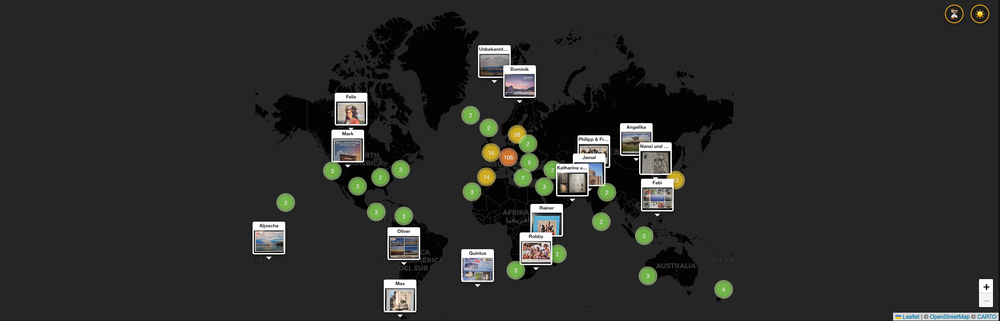
To not overload the visitor's browser, I use Leaflet.js combined with Leaflet.markercluster.
Instead of standard blue pins, I wanted each marker to be a miniature preview of the postcard itself. This is done by using Leaflet's divIcon, which allows us to pass raw HTML as a marker.
Clustering
Even with static the JSON, rendering a ton of images is heavy. MarkerCluster solves this by grouping nearby pins into a colored circle. As you zoom in, the clusters break apart.
I customized the "Spiderfy" effect so that clicking a tight cluster spirals the cards out, letting you pick the exact one you want.
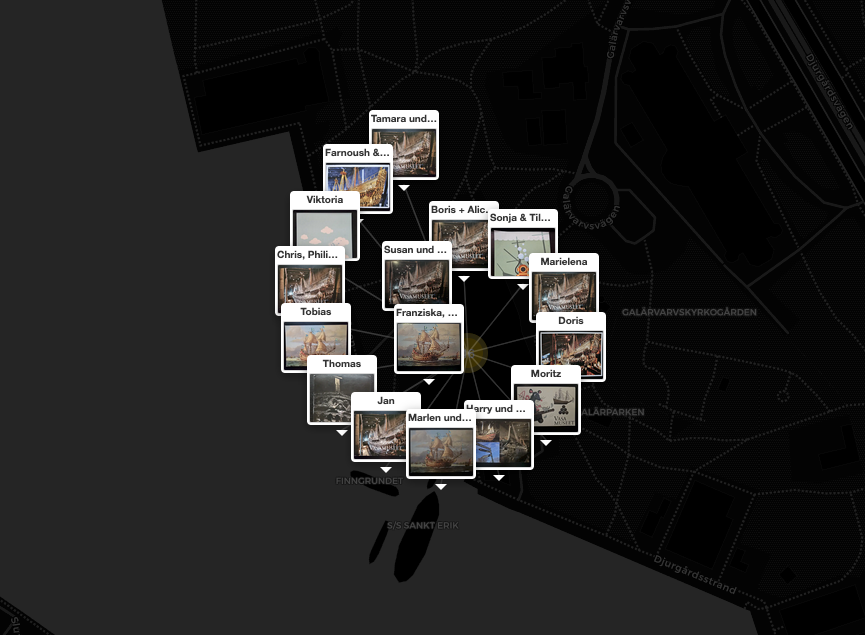
I originally had the names of the senders at the bottom of the preview, putting it above the thumb solved the problem of illegibility in a spider cluster.
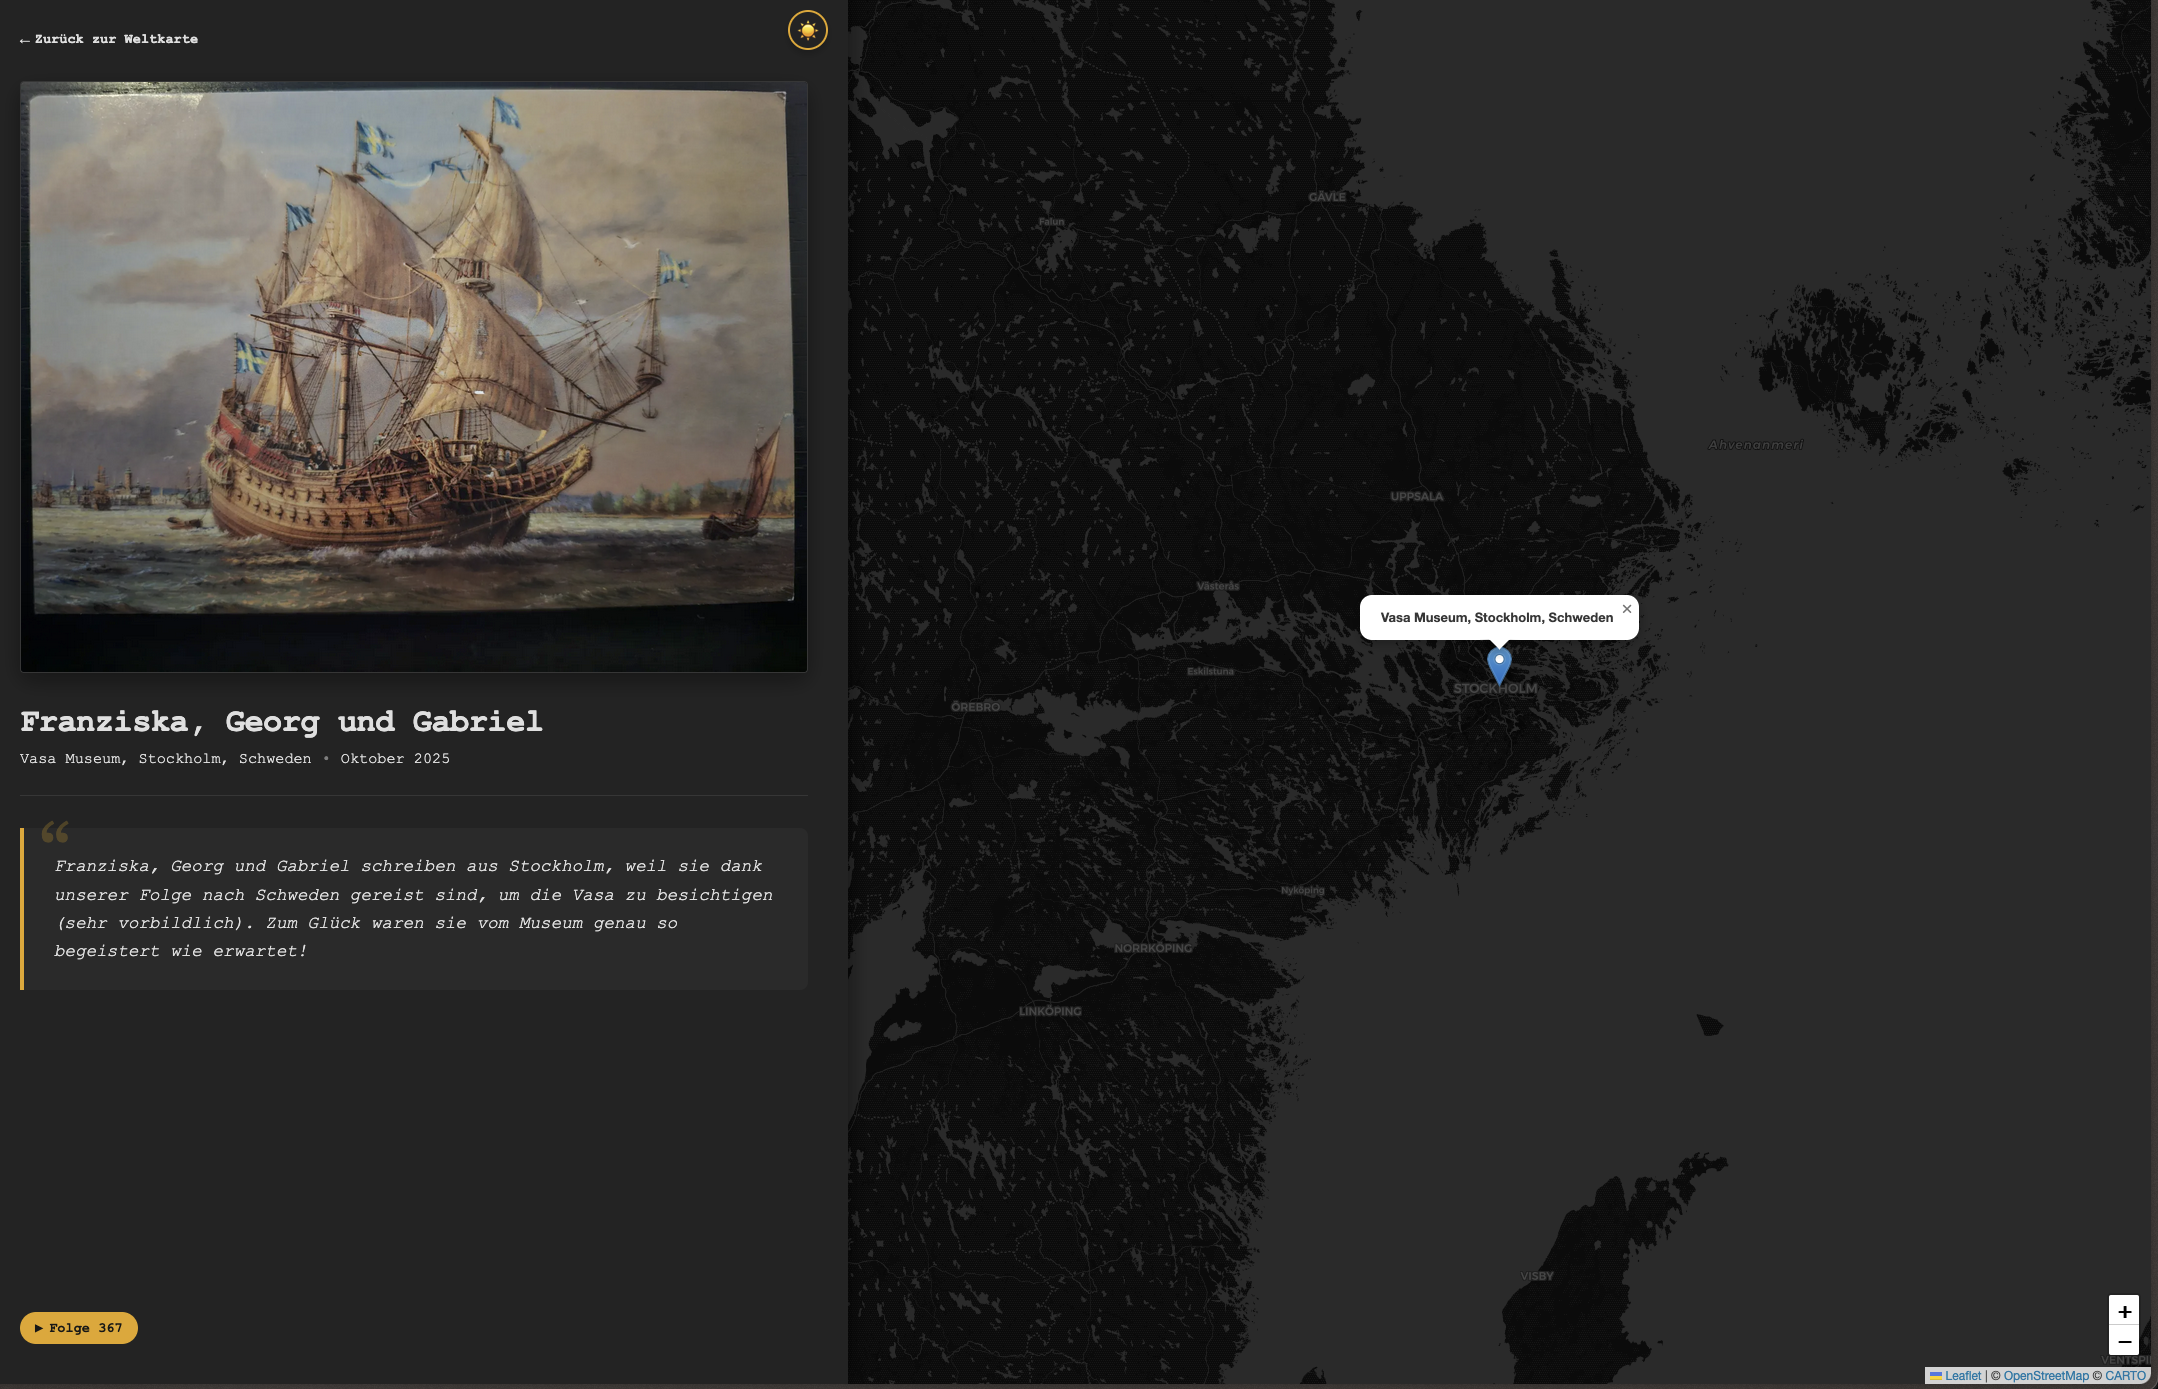
Every postcard, when clicked, is opened on its dedicated page, with a pretty little permalink.
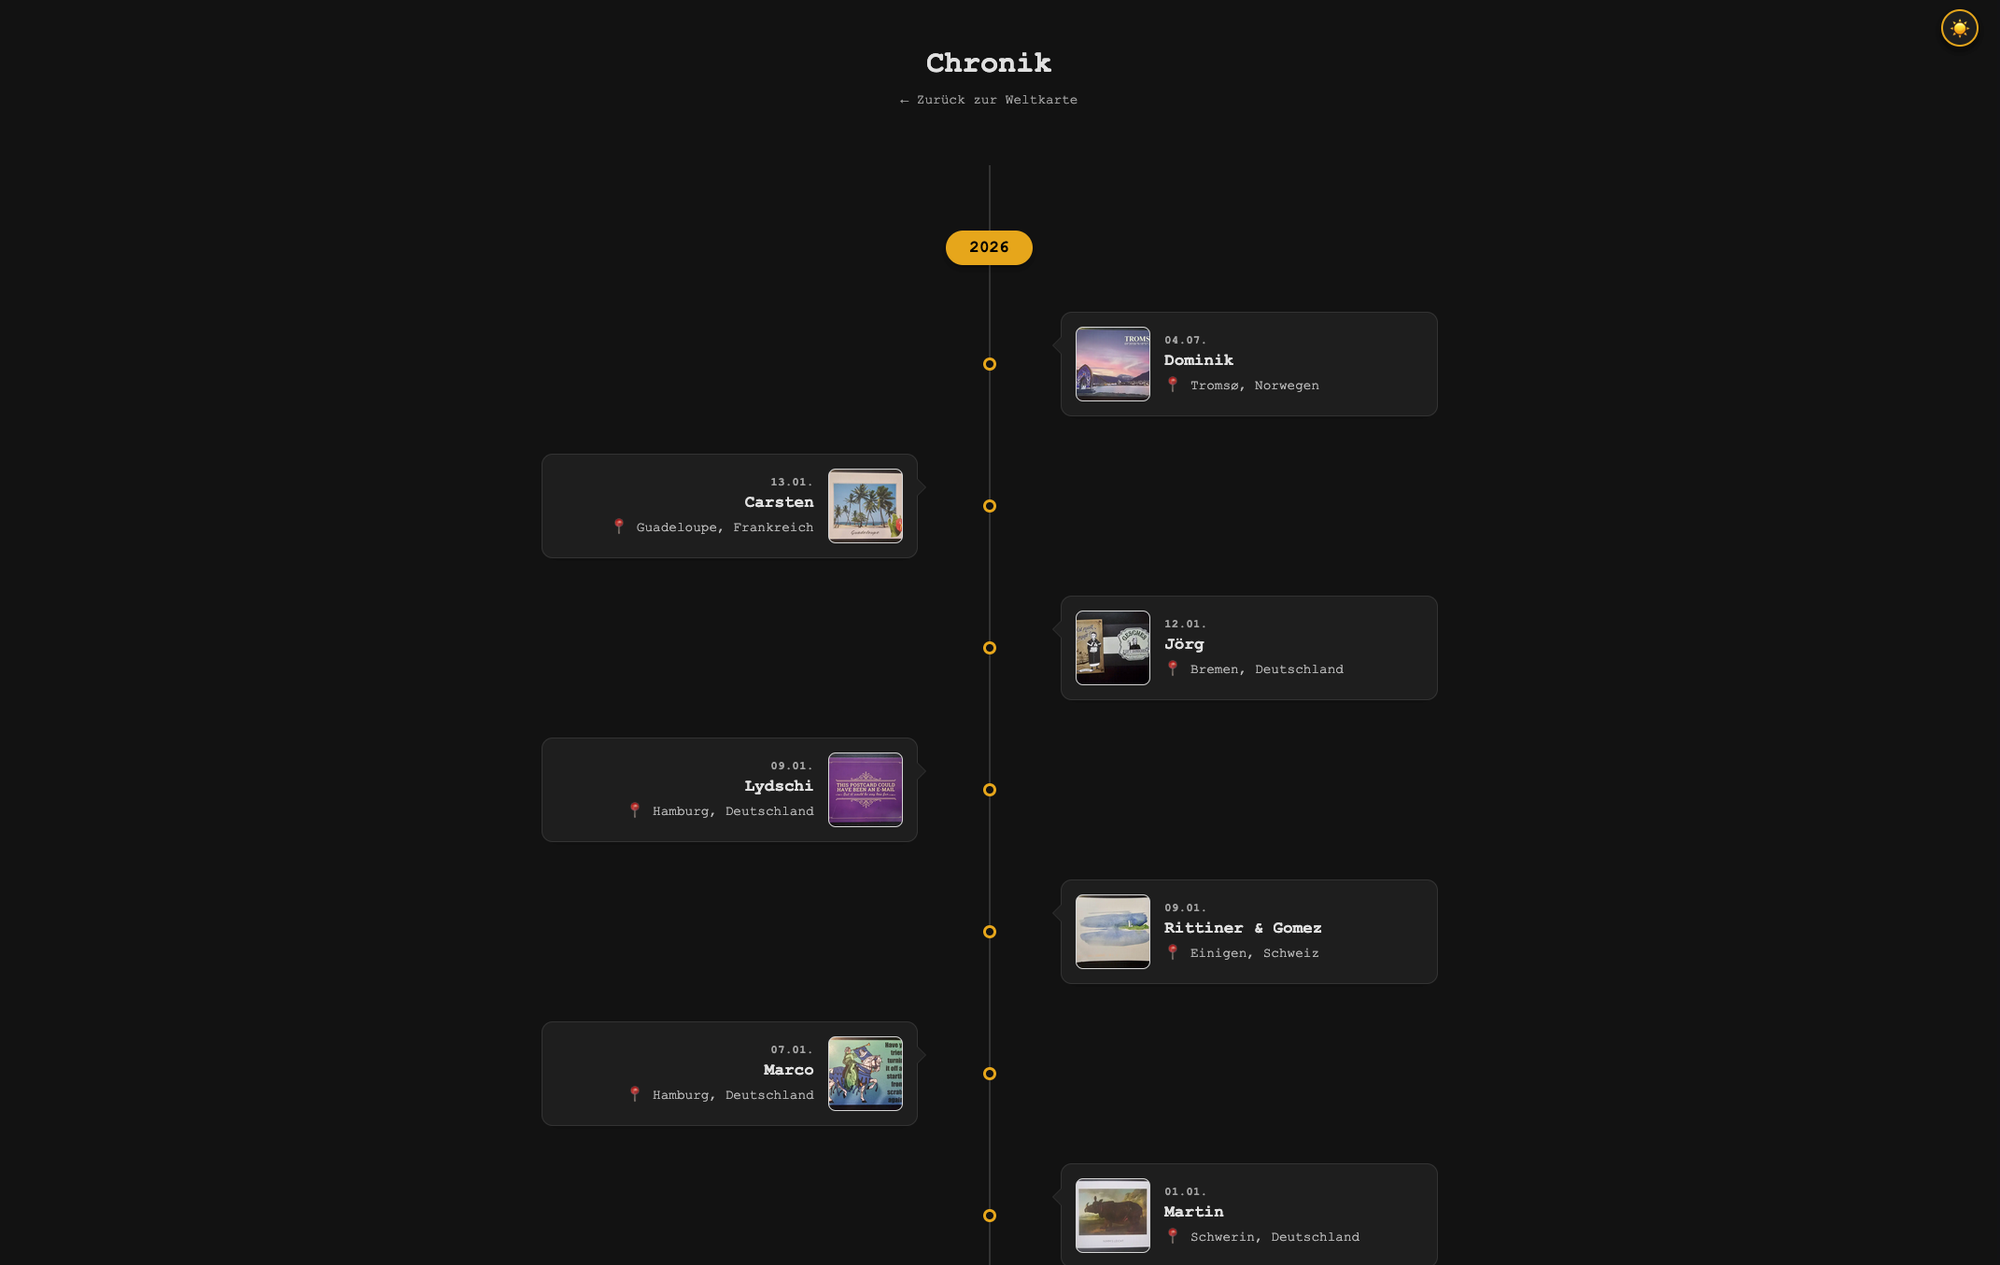
And simply because I think some people would appreciate it, I added a timeline view, which lets you look at the postcards sorted by the time they were sent (or arrived).
Style & Flexibility: The Backend Map Switcher
I didn't want the map to blind users at night, so I implemented a dynamic theme toggler that swaps between dark and light mode. Look for the switch in the upper right corner.
For the default look, I chose Carto basemaps, but have also added Stadia Maps (specifically the Alidade Smooth style).
To avoid being locked in, I built a Mapbase Switcher in the admin backend.
If Stadia ever goes down (or Carto turns off their free basemaps), I can quickly switch between the two or even the basic OpenStreetMap basemap. No code changes required.
Note: Both Stadia and Carto are essentially high-performance "skins" for OpenStreetMap data. So no matter which one I choose, I am always relying on the same open-source foundation.
Finding the Places
Speaking of OpenStreetMap: To find the correct latitude and longitude for a postcard, I use the Nominatim API, which is the official search engine for OpenStreetMap.
When I type a location like "Mainz, Germany" into the backend, a small JavaScript function fires a request directly to Nominatim and moves the pin to the result. It is free, open, and incredibly accurate.
The process
Gemini turned out to be a splendid co-coder (well, let's be honest, it did most of the heavy lifting). I didn't use an actual editor with a Gemini extension at first (simply hammered it all out in the normal chat window and waited for the code to be generated, then copy and pasted), but I've since switched to using Google's Antigravity, which is their agentic programming editor. And what can I say, it works like a charm.
All in all, very happy with the result, and I hope I'll still be once I've added the backlog of postcards (I'm guessing around 600 or so).